eCommerce Brand 1,119% AI Active-User Growth. 68.97% Mention Coverage. 2.15 Average AI Ranking.
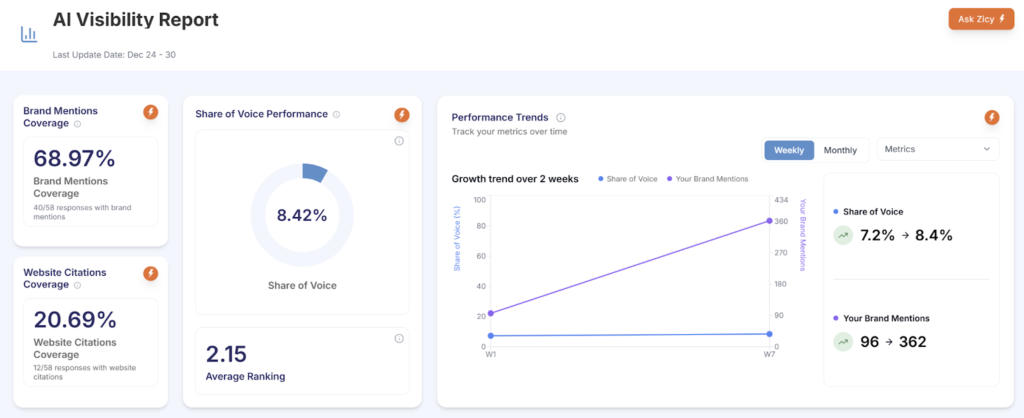
An eCommerce brand came to Growth.pro with a healthy traditional commerce funnel and zero visibility into how AI platforms were referencing the brand on product discovery and comparison queries. Through a full PAVA engagement, the brand reached 68.97% mention coverage, held a 2.15 average AI ranking position with higher consistency than competitors carrying larger raw […]
B2B Advisory Brand · 150 Tracked Prompts 90.61% AI Mention Coverage. 2.17 Average Ranking. Category Leader On Share of Voice
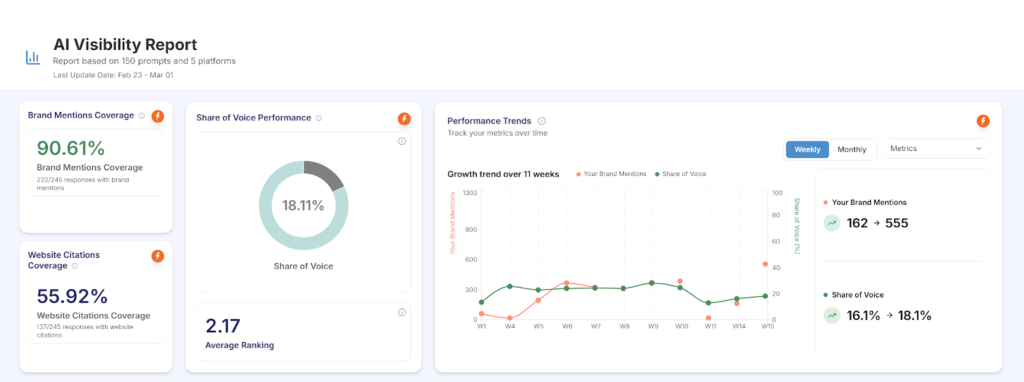
A B2B advisory brand operating in a high-trust category came to Growth.pro to evaluate how consistently the brand was being mentioned, cited, and ranked inside AI answers. The brand held the highest share of voice among five direct competitors at 18.11%, 90.61% mention coverage across 150 tracked prompts, and an average AI ranking position of […]
B2B Service Provider · 130 Tracked Prompts Ranking Stability Programme. 2.37 Average AI position Across Five Platforms.
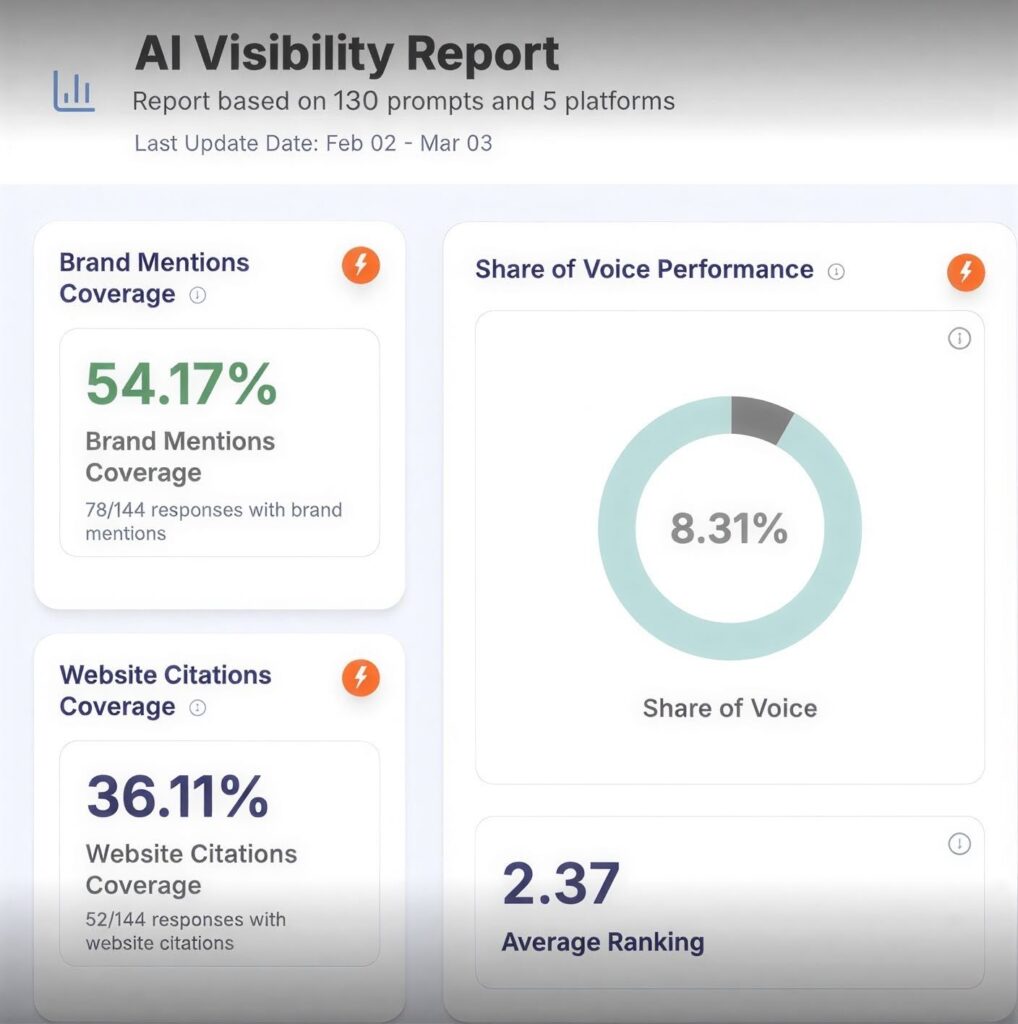
A B2B service provider with existing AI category presence came to Growth.pro to address ranking-position consistency. Mention coverage was 54.17% on the baseline audit, with strong performance on “best provider” searches but inconsistent positioning on comparison queries and on prompts where competitor density was rising. The engagement focused on precision and reinforcement, not headline growth. […]
Education Services Brand · 39 Tracked Prompts Category #1 Share Of Voice. 23.04%. 12,507% YoY AI Traffic Growth.
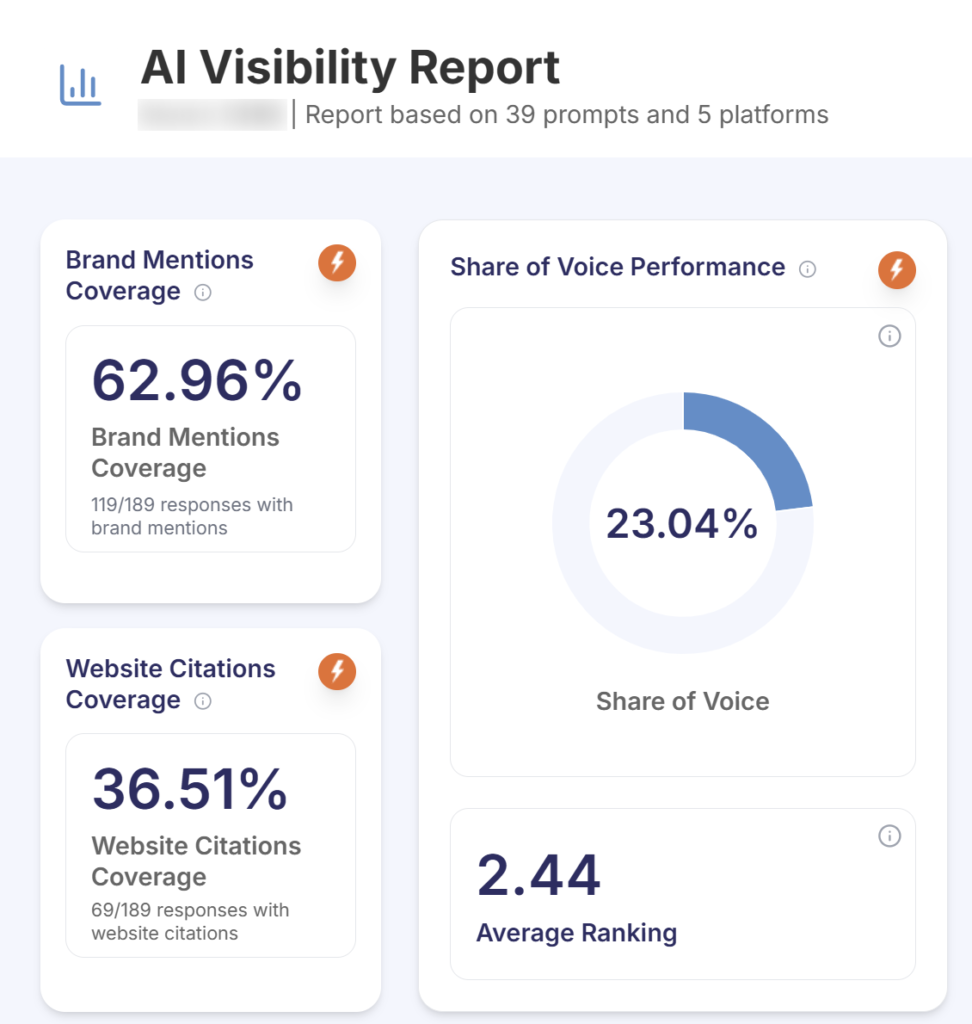
An education-services brand in a knowledge-led category came to Growth.pro with inconsistent AI visibility across the five major platforms. Smaller competitors with sharper category positioning were being named ahead of the brand on priority queries. Through a full PAVA engagement, the brand took the top share-of-voice position in the category at 23.04%, with 62.96% mention […]
Ecommerce Brand #1 Category Share Of Voice In AI. 82.86% Mention Coverage. Even While Competitors LED On Google.
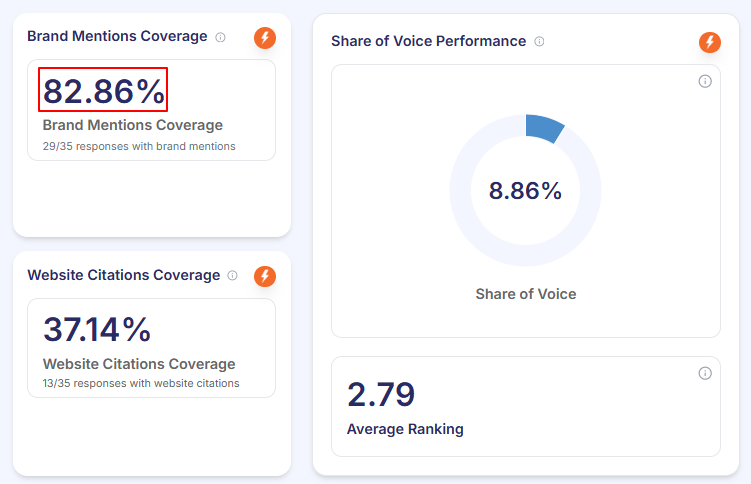
An eCommerce brand came to Growth.pro with stable Google rankings, healthy organic traffic, and inconsistent AI visibility. Competitors with weaker Google positions were being recommended more often inside AI platforms. Through a full PAVA engagement, the brand took the #1 share-of-voice position in its category at 8.86%, with 82.86% mention coverage, 37.14% citation rate, and […]
AI Traffic To A Us Ecommerce Brand Grew 1,207% While Total Site Traffic Grew 21%. The Product Pages Were Getting Cited By ChatGPT, Gemini, And Perplexity Directly.
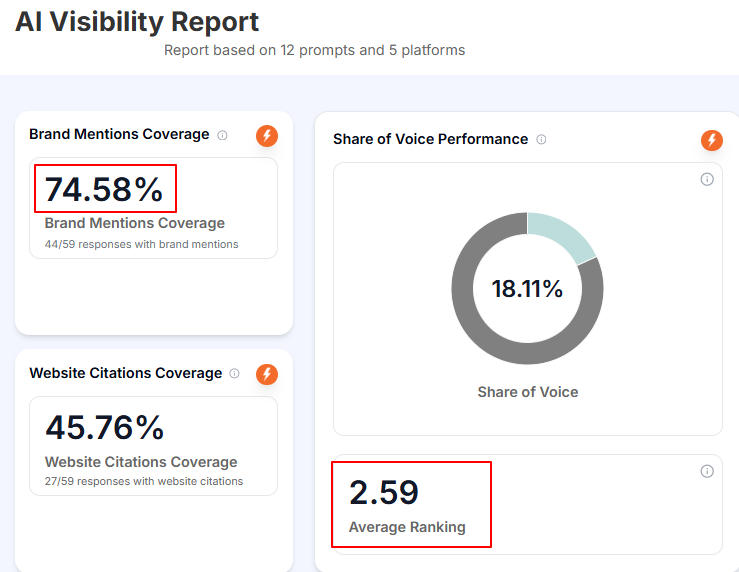
A US-based eCommerce brand selling contact lenses online came to Growth.pro with healthy traditional commerce performance and inconsistent AI visibility. Buyers were running comparison-heavy AI shortlist queries before purchase. Through a full PAVA engagement, the brand took the #1 share-of-voice position in its category at 18.11%, with 74.58% mention coverage and 45.76% citation rate. AEO […]
Architectural Services Brand · 8 Months Zero To 99 AI Citations. +12,800% YoY AI Traffic.
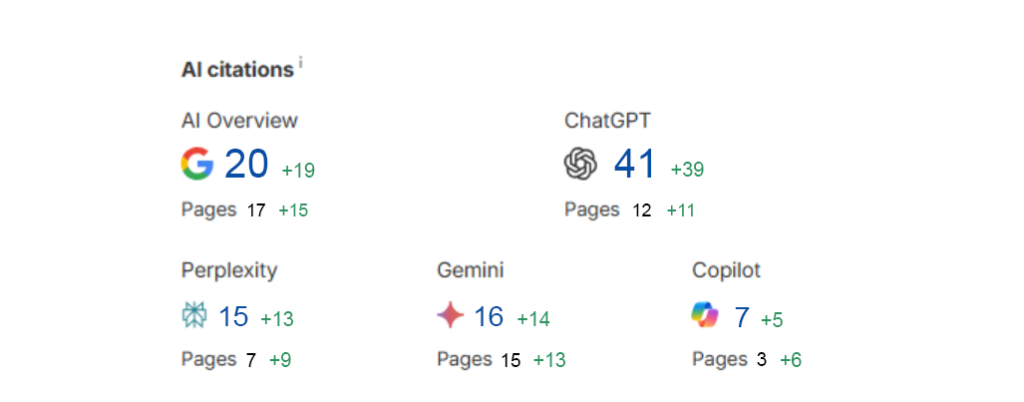
An architectural services brand came to Growth.pro with zero AI citations in December 2024. Over eight months of PAVA work, the brand secured 99 AI citations across ChatGPT, Google AI Overviews, Gemini, Perplexity, and Copilot. Year-on-year AI traffic grew 12,800% and AI events grew 21,800%. Non-branded queries surged disproportionately, confirming category-level discovery via AI. THE […]
Education Brand · 90 Days Category Default Position Established. 56.32% Mention Coverage, 3.5-to-1 Earned-to-Owned Citation Ratio

An education-sector brand operating in a long-consideration buyer journey came to Growth.pro with inconsistent AI visibility across the five major platforms. Prospective students were running shortlist-stage queries that the brand was inconsistently appearing in, and competitors with smaller academic footprints were collecting category citations. Ninety days into a full PAVA engagement, the brand held 12.47% […]
eCommerce Brand · Foundational PAVA Engagement +290% Clicks. +457% Impressions. +15 Spots Average Position. Zero New Pages Published.
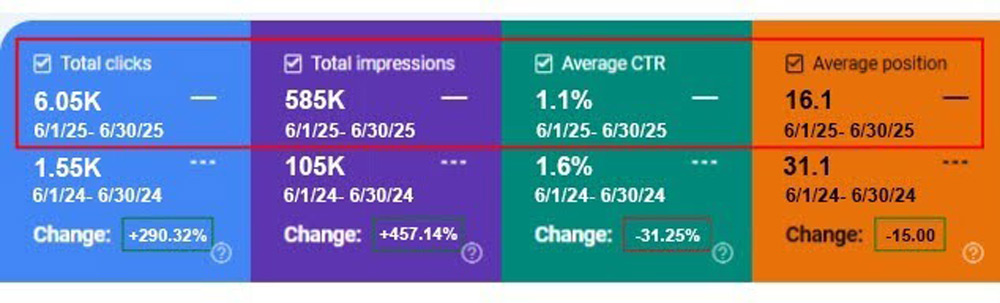
An eCommerce brand engaged Growth.pro for foundational AI-readiness work on its existing content rather than a new-content commissioning programme. Through restructuring of existing pages, monthly clicks grew 290.32%, monthly impressions grew 457.14%, and average search position improved 15 spots, all measured year over year (June 2025 vs June 2024). The lift was produced without publishing […]
Services Brand · 7 Months 1,088 AI-referred Users. 1,966 Tracked Conversion Events. +406% ChatGPT Event Growth.
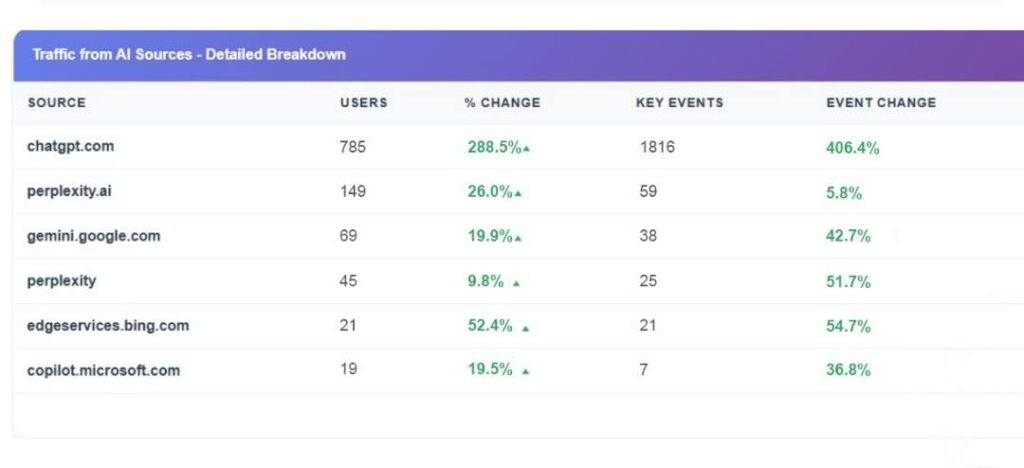
A services brand engaged Growth.pro to verify whether AI search produced attributable users and converting buyers in their category. Over seven months (January to July 2025), AI search delivered 1,088 users and 1,966 tracked conversion events. ChatGPT event growth was 406.4%. Every platform measured produced material event growth. THE ENGAGEMENT The brand’s PR partners continued […]